


Appearance
Appearance
Wireshark is an open-source, cross-platform network packet analyser tool capable of sniffing and investigating live traffic and inspecting packet captures (PCAP). It is commonly used as one of the best packet analysis tools.
Packet capture (PCAP) is a networking practice involving the interception of data packets travelling over a network. Once the packets are captured, they can be stored by IT teams for further analysis. The inspection of these packets allows IT teams to identify issues and solve network problems affecting daily operations.
Packet Dissection
Packet dissection is also known as protocol dissection, which investigates packet details by decoding available protocols and fields. Wireshark supports a long list of protocols for dissection, and you can also write your dissection scripts. You can find more details on dissection here.
Note: This section covers how Wireshark uses OSI layers to break down packets and how to use these layers for analysis.
Packet Details
You can click on a packet in the packet list pane to open its details (double-click will open details in a new window). Packets consist of 5 to 7 layers based on the OSI model.
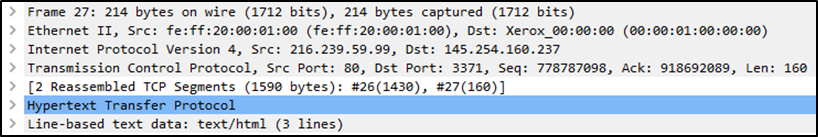
We can see seven distinct layers to the packet: frame/packet, source [MAC], source [IP], protocol, protocol errors, application protocol, and application data. Below we will go over the layers in more detail.
The Frame (Layer 1): This will show you what frame/packet you are looking at and details specific to the Physical layer of the OSI model.
.eHKYIKfW.png)
Source [MAC] (Layer 2): This will show you the source and destination MAC Addresses; from the Data Link layer of the OSI model.
![Source [MAC] (Layer 2)](/assets/Source%20_MAC_%20(Layer%202).B6RfxtCW.png)
Source [IP] (Layer 3): This will show you the source and destination IPv4 Addresses; from the Network layer of the OSI model.
![Source [IP] (Layer 3)](/assets/Source%20_IP_%20(Layer%203).Dilyb8pR.png)
Protocol (Layer 4): This will show you details of the protocol used (UDP/TCP) and source and destination ports; from the Transport layer of the OSI model.
.BXl5nRdC.png)
Protocol Errors: This continuation of the 4th layer shows specific segments from TCP that needed to be reassembled.
![Protocol Errors]Pro(<assets/tocol Errors.png>)
Application Protocol (Layer 5): This will show details specific to the protocol used, such as HTTP, FTP, and SMB. From the Application layer of the OSI model.
.BBBUwU-w.png)
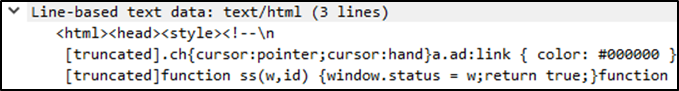
Application Data: This extension of the 5th layer can show the application-specific data.
Packet Nivagation
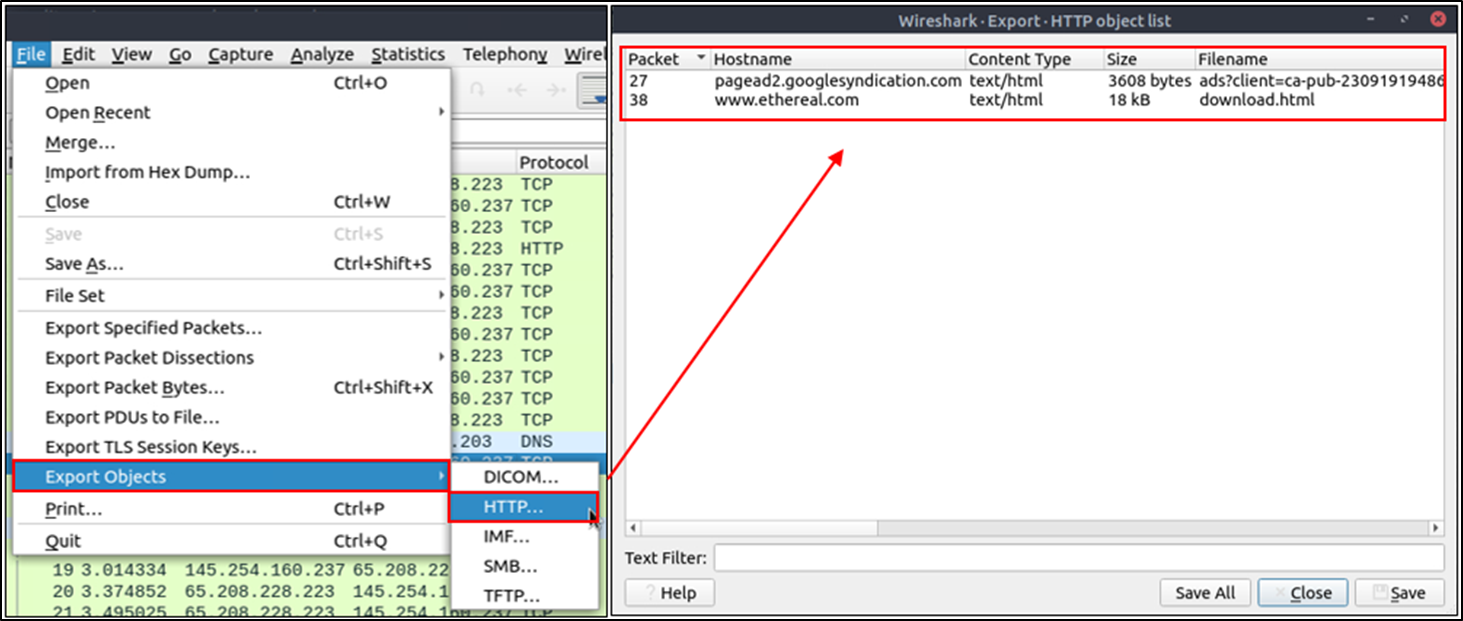
Export Objects (Files)
Wireshark can extract files transferred through the wire. For a security analyst, it is vital to discover shared files and save them for further investigation. Exporting objects are available only for selected protocol's streams (DICOM, HTTP, IMF, SMB and TFTP).
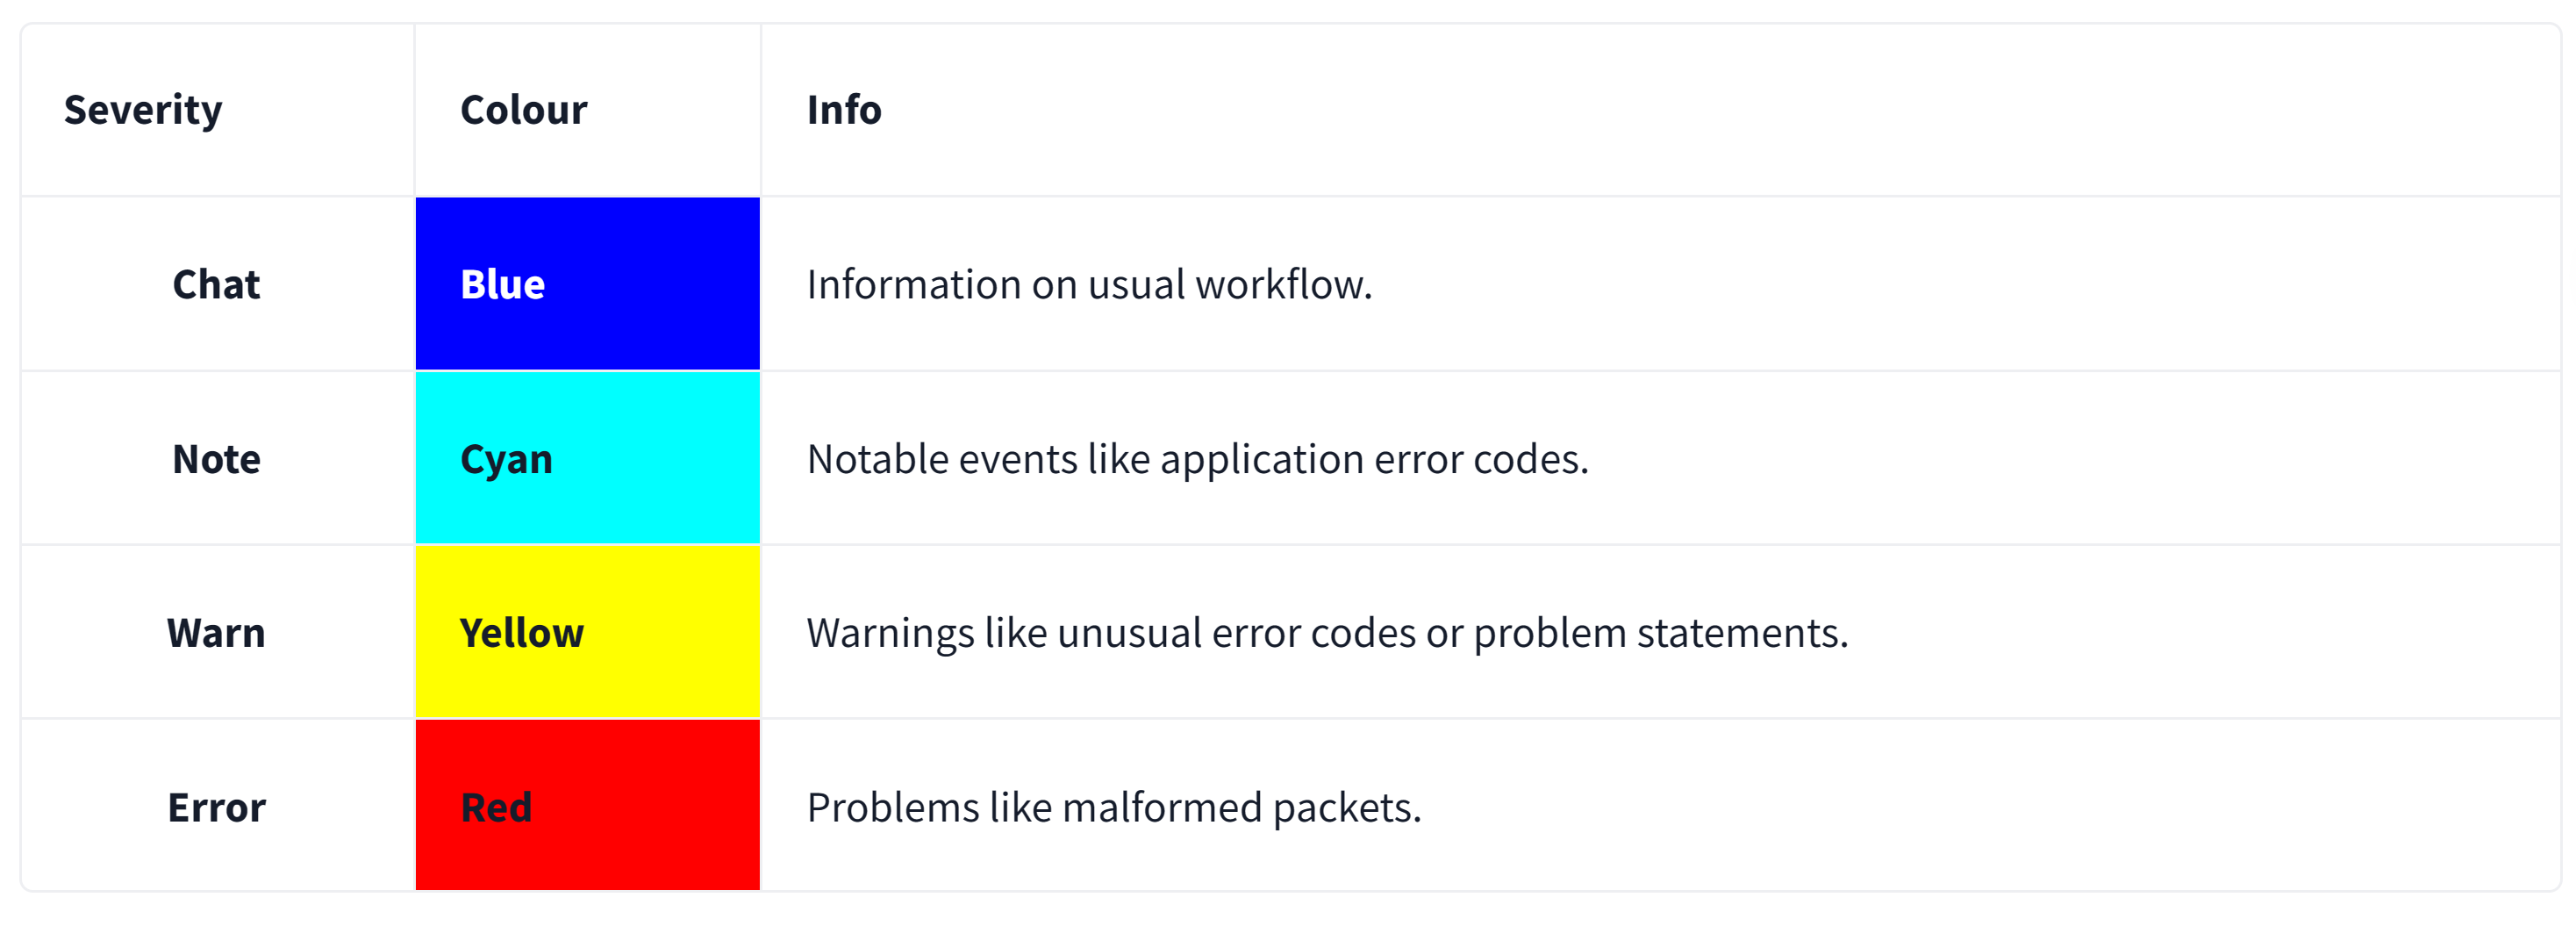
Expert Info
Wireshark also detects specific states of protocols to help analysts easily spot possible anomalies and problems. Note that these are only suggestions, and there is always a chance of having false positives/negatives. Expert info can provide a group of categories in three different severities. Details are shown in the table below.
Packet Filtering
Wireshark has a powerful filter engine that helps analysts to narrow down the traffic and focus on the event of interest. Wireshark has two types of filtering approaches: capture and display filters. Capture filters are used for "capturing" only the packets valid for the used filter. Display filters are used for "viewing" the packets valid for the used filter. We will discuss these filters' differences and advanced usage in the next room. Now let's focus on basic usage of the display filters, which will help analysts in the first place.
Filters are specific queries designed for protocols available in Wireshark's official protocol reference. While the filters are only the option to investigate the event of interest, there are two different ways to filter traffic and remove the noise from the capture file. The first one uses queries, and the second uses the right-click menu. Wireshark provides a powerful GUI, and there is a golden rule for analysts who don't want to write queries for basic tasks: "If you can click on it, you can filter and copy it"
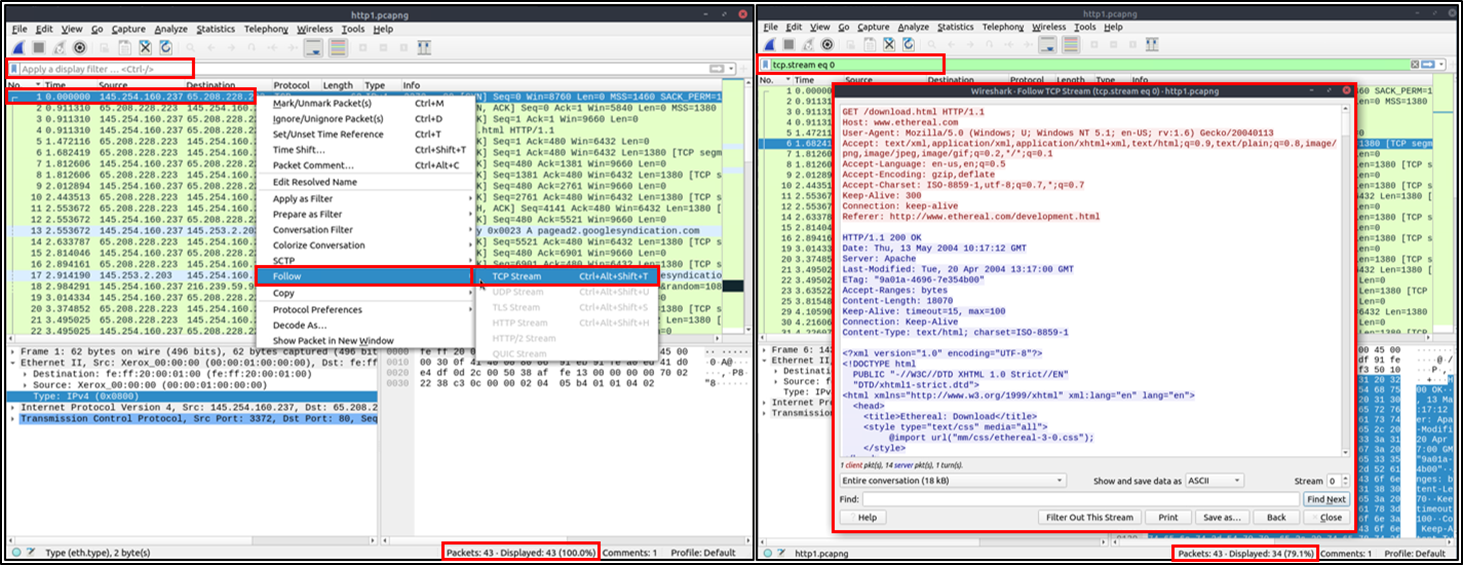
Follow Stream
Wireshark displays everything in packet portion size. However, it is possible to reconstruct the streams and view the raw traffic as it is presented at the application level. Following the protocol, streams help analysts recreate the application-level data and understand the event of interest. It is also possible to view the unencrypted protocol data like usernames, passwords and other transferred data.
You can use the"right-click menu" or "Analyse --> Follow TCP/UDP/HTTP Stream" menu to follow traffic streams. Streams are shown in a separate dialogue box; packets originating from the server are highlighted with blue, and those originating from the client are highlighted with red.
常用过滤
过滤出包含jpeg图片格式的HTTP2请求
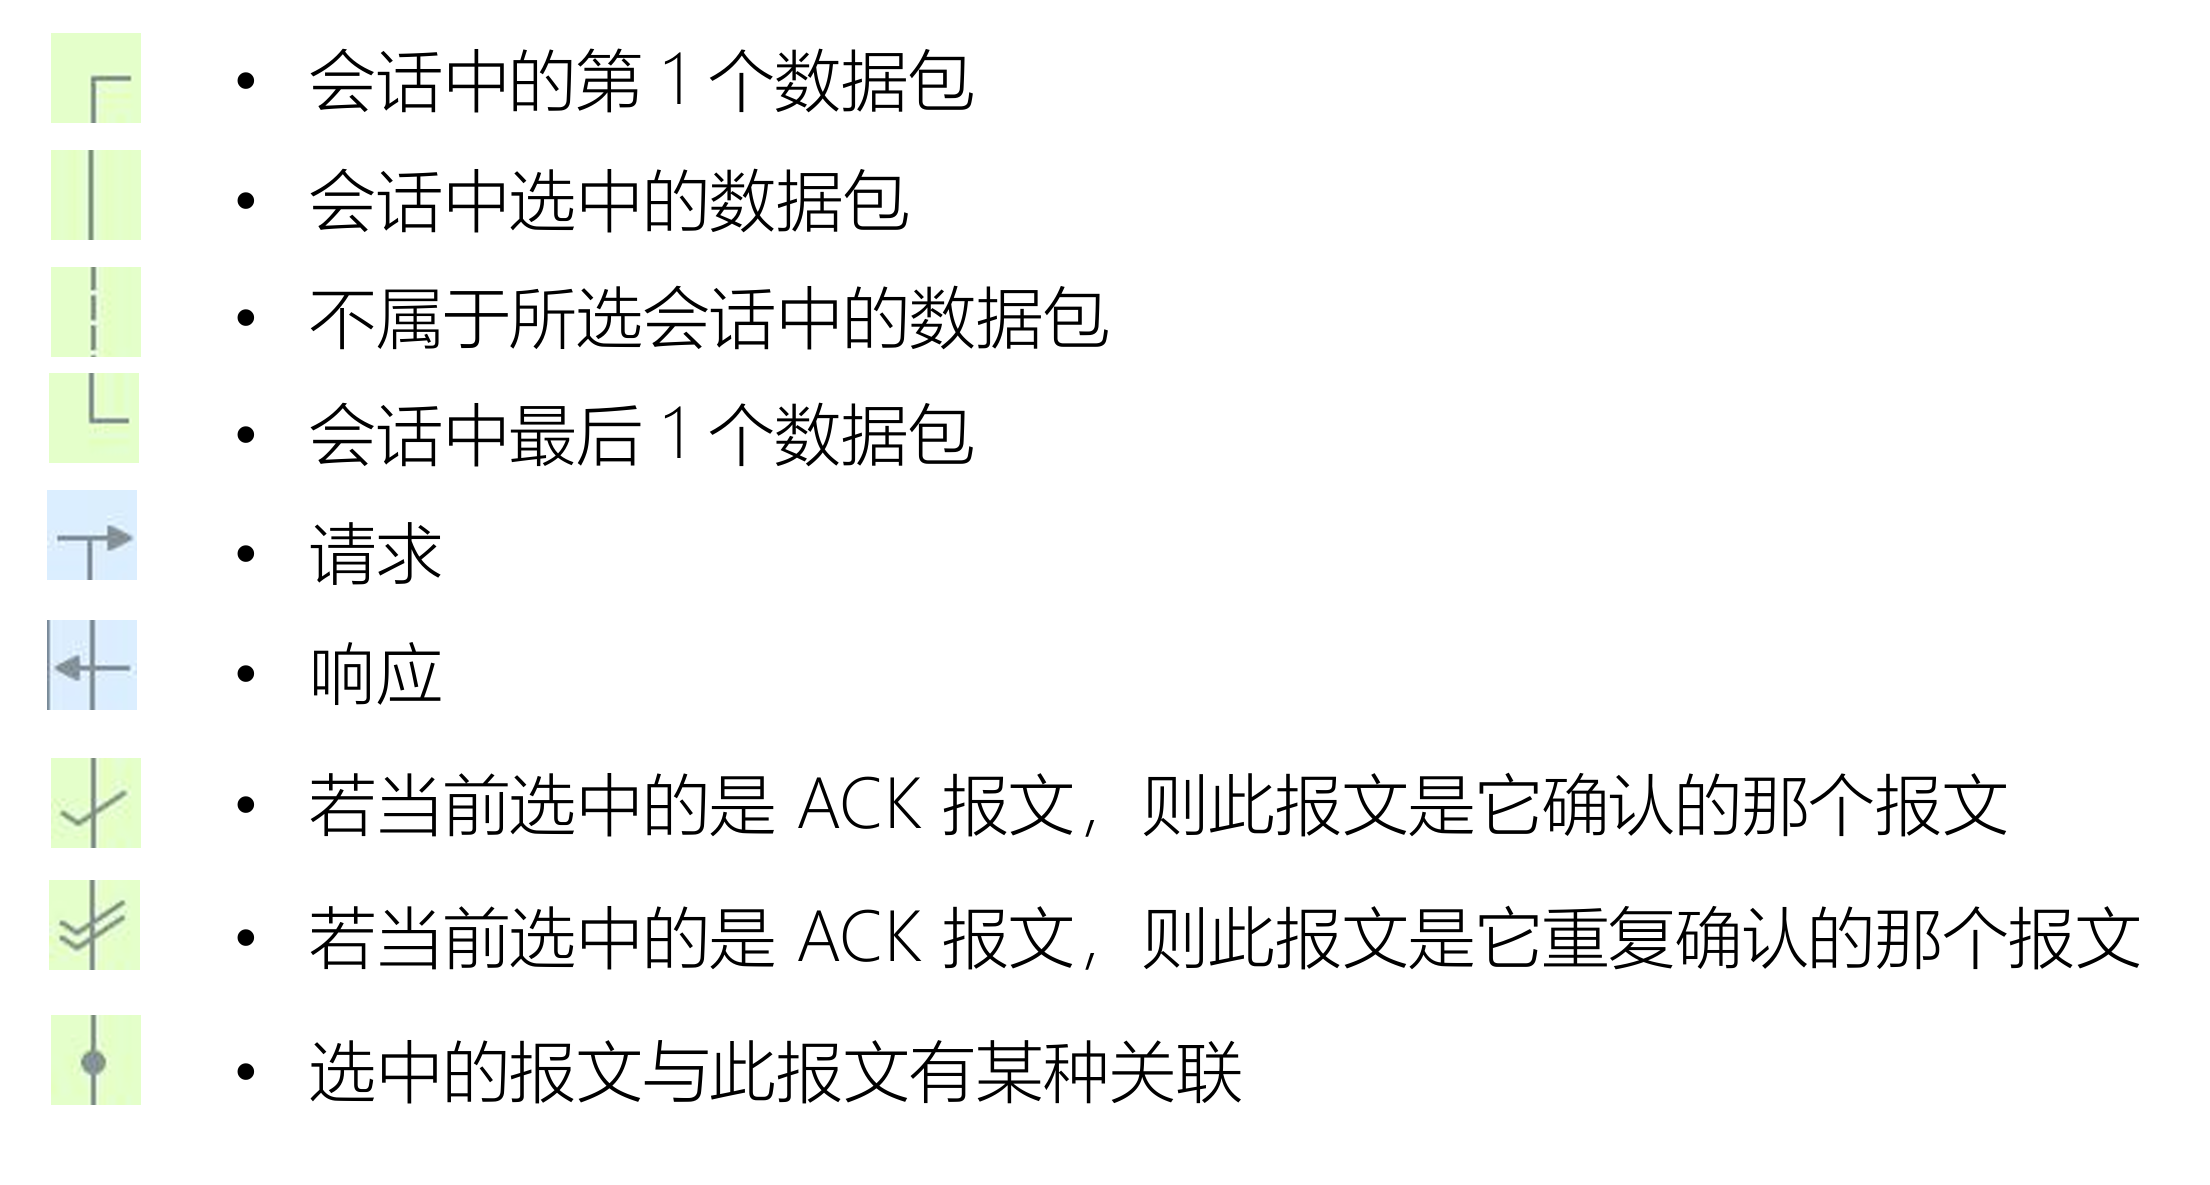
http2.headers.content_type contains "image/jpeg"数据包列表面板的标记符号
捕获过滤器
显示过滤器
Wireshark 捕获过滤器
Expression 表达式
primitives 原语:由名称或数字,以及描述它的多个限定词组成
原语运算符
例如:src or dst portrange 6000-8000 && tcp or ip6
限定词
Type:设置数字或者名称所指示类型
Dir:设置网络出入方向
Proto:指定协议类型
其他
基于协议域过滤
显示过滤器的过滤属性
任何在报文细节面板中解析出的字段名,都可以作为过滤属性
过滤值比较符号
| 英文 | 符号 | 描述及示例 |
|---|---|---|
| eq | == | 等于. ip.src==10.0.0.5 |
| ne | != | 不等于. ip.src!=10.0.0.5 |
| gt | > | 大于. frame.len > 10 |
| lt | < | 小于. frame.len < 128 |
| ge | >= | 大于等于. frame.len ge 0x100 |
| le | <= | 小于等于. frame.len <= 0x20 |
| contains | 包含. sip.To contains "a1762" | |
| matches | ~ | 正则匹配. host matches "acme\.(org|com|net)" |
| bitwise_and | & | 位与操作. tcp.flags & 0x02 |
过滤值类型
多个表达式间的组合
| 英文 | 符号 | 意义及示例 |
|---|---|---|
| and | && | AND 逻辑与. ip.src==10.0.0.5 and tcp.flags.fin |
| or | || | OR 逻辑或. ip.src==10.0.0.5 or ip.src==192.1.1.1 |
| xor | ^^ | XOR 逻辑异或. tr.dst[0:3] == 0.6.29 xor tr.src[0:3] == 0.6.29 |
| not | ! | NOT 逻辑非. not llc |
| [...] | 见 Slice 切片操作符. | |
| in | 见集合操作符. |
其他常用操作符
可用函数
| 函数名 | 描述 |
|---|---|
| upper | Converts a string field to uppercase. |
| lower | Converts a string field to lowercase. |
| len | Returns the byte length of a string or bytes field. |
| count | Returns the number of field occurrences in a frame. |
| string | Converts a non-string field to a string. |
原理:获得 TLS 握手阶段生成的密钥
步骤
SSLKEYLOGFILE从 wireshark 报文统计中找规律
报文统计
报文总体分布
协议分级统计(配合显示过滤器)
端点统计/会话统计
OSI 不同层次统计
快速应用过滤器及着色规则
HTTP/HTTP2 统计
TCP 连接信息统计
IO 图表与数据流统计
IO 图表
数据流
专家系统